The case for converged application and infrastructure monitoring
Tue, 8th Dec 2020
IT monitoring tools are almost as old as the industry itself. They have gone through many permutations. Some have been designed for networks, some for databases, and others for virtualisation platforms — in addition to many more.
Over time, IT monitoring became even further fractured. Application owners and infrastructure administrators are increasingly split into disparate teams within an organisation, and as a result, separate tools have been adopted for application monitoring and infrastructure monitoring. In many organisations, even for just infrastructure monitoring, many tools may be employed.
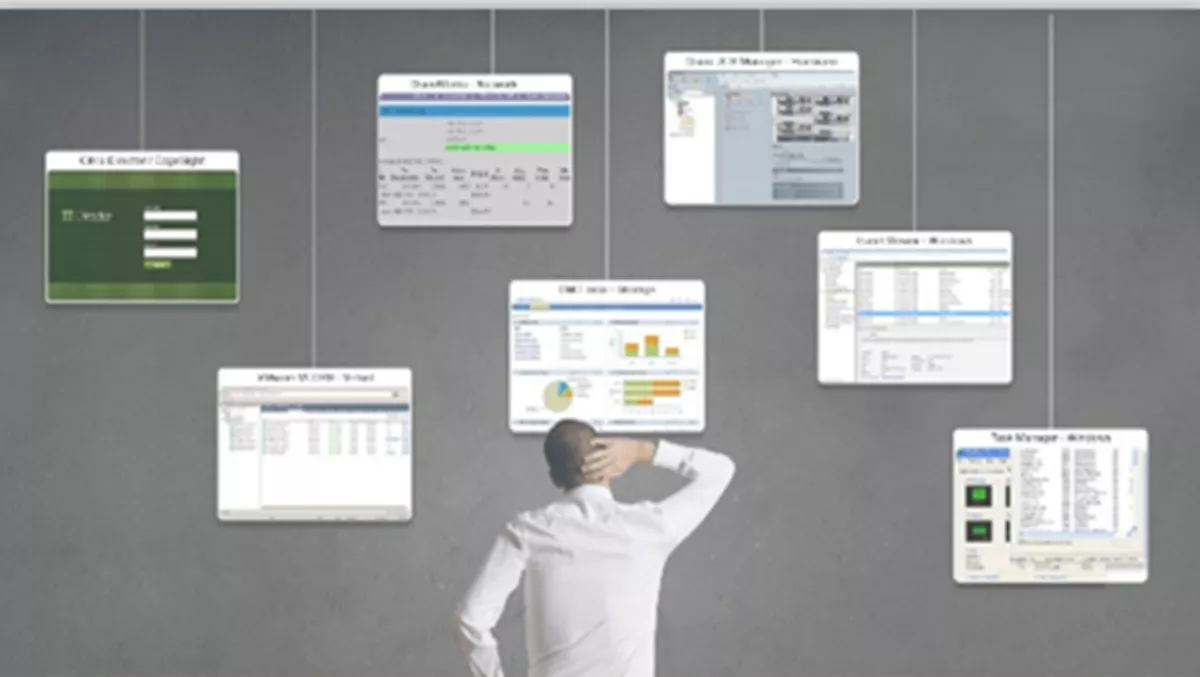 Having many different monitoring tools is a challenge for most IT managers
Consolidate your IT Monitoring for Efficiency
IT managers and operations teams have begun to realise that using disparate monitoring tools to aggregate application and infrastructure metrics to get a correlated end-to-end view is unsustainable.
A lot of manual effort is involved in correlating metrics. This is time-consuming and analysing the metrics and interpreting them to detect where the bottleneck lies requires a lot of technical expertise that is lacking in many organisations.
And it's not just about monitoring tool consolidation. As digital user experience (UX) drives business in 2020 at a rapidly increasing rate, application owners and IT professionals can be at loggerheads in an instant if a performance slowdown occurs. Without a genuinely unified and holistic view of all factors — across applications and the infrastructure — that affect UX, the organisation is effectively flying blind.
When a user complains that their application is slow, where is the root-cause? Is it in the application code, or network, or database, or storage, or cloud tier?
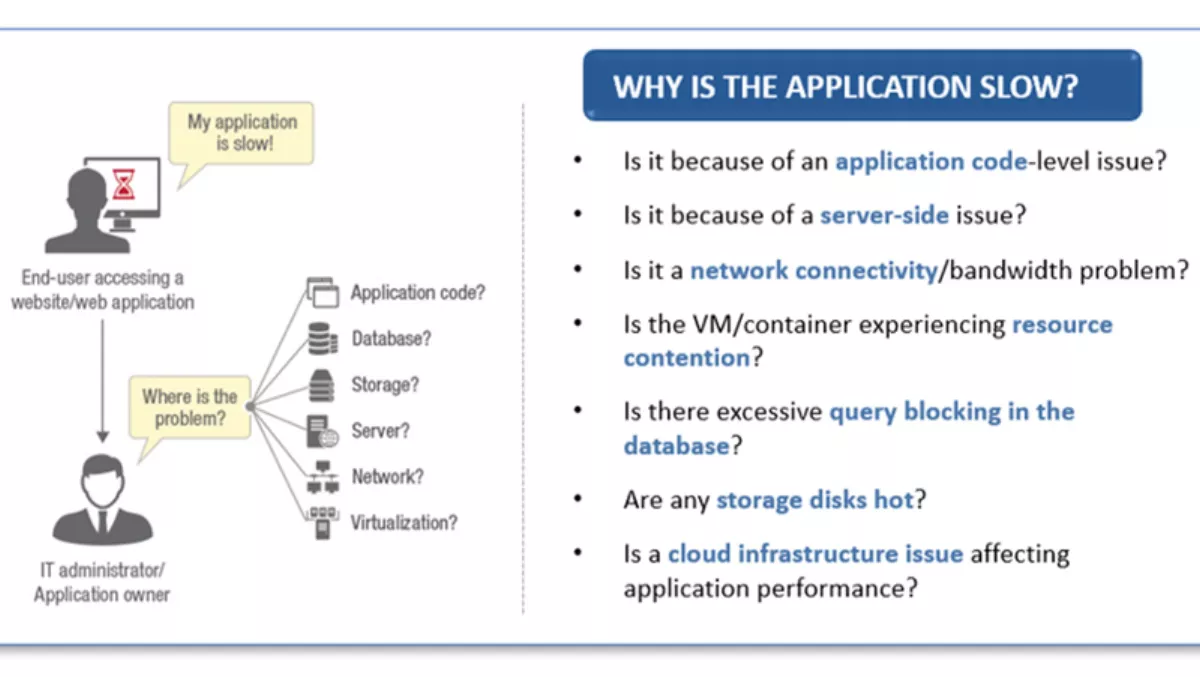 An IT Manager's biggest nightmare: Troubleshooting application slowness issues
Detecting the root cause of a slowdown can be a challenge because today's applications and infrastructures are highly interdependent. Understanding the dependencies between the application and underlying infrastructure is imperative.
Sometimes slowdowns can be caused by application issues – e.g., a memory leak, or a run-away thread, while at other times, it could be due to an infrastructure issue – e.g., a VMware server running out of resources, or a failed disk.
While an application monitoring tool detects application-level issues, infrastructure tools are required to detect infrastructure issues. Having multiple tools and consoles leads to the inefficiencies discussed earlier. This is why a converged application and infrastructure monitoring strategy is critical.
A growing trend: converged application and infrastructure monitoring solution
A converged application and infrastructure monitoring solution provides unified visibility of the entire application stack – from user experience, business transactions, application code, all the way to the supporting infrastructure tiers.
Such a solution collects, assimilates, and correlates all the events in the application and infrastructure environment, and allows for easy and rapid troubleshooting of problems, thereby reducing mean time to repair (MTTR).
It provides different views for different stakeholders in your IT organisation. With such a solution, you can:
- Monitor user experience and proactively detect issues before your users are impacted
- Get code-level visibility to identify inefficient application code, long-running database queries, or slow third-party calls
- Monitor all of the supporting infrastructure in one console, and in the context of the application being analysed
- Automatically map application dependencies within the infrastructure to pinpoint the root cause of problems
- Get actionable insights in your fingertips to enhance application performance and plan for upgrades
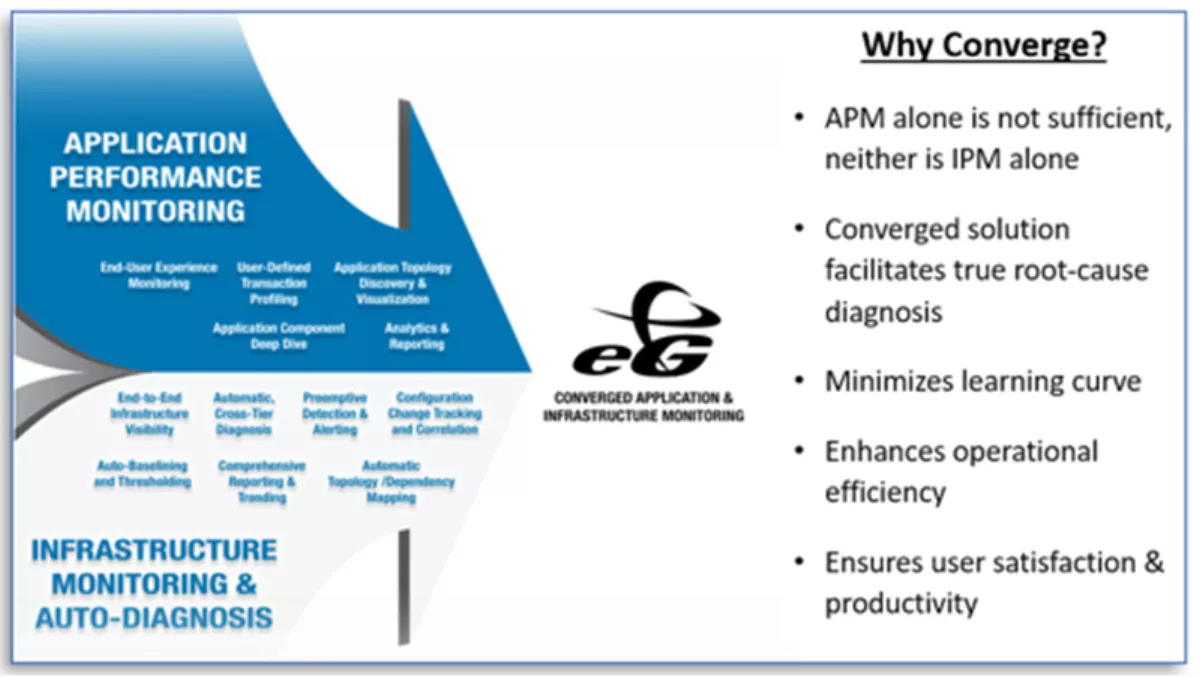 How converged application and infrastructure monitoring helps
Recognising this trend, vendors like DataDog, Splunk, IBM and Solarwinds, who have predominantly focused on infrastructure monitoring, have introduced application monitoring capabilities in their product suites. Application performance monitoring vendors like NewRelic have also added infrastructure monitoring capabilities.
At the same time, convergence of application and infrastructure monitoring is not just about providing one console with two independent modules for application and infrastructure monitoring.
The real value of convergence can be realised only if application and infrastructure monitoring capabilities are tightly integrated. That is, infrastructure performance metrics are reviewed in the context of the applications they support.
How eG Innovations help IT managers
Organisations are placing a lot of emphasis on user experience, and this is where a converged application and infrastructure monitoring solution can help.
How fast an application is in responding to a user is just one of the measures of UX. How often a problem happens, when a problem happens, how quickly it can be fixed, how accurate is the diagnosis, and how proactive was the alerting — all of these contribute to UX.
eG Enterprise from eG Innovations addresses the user experience needs of organisations in all these areas. Users can monitor all business-critical applications and infrastructure from a single console, from the data center to the cloud, as well as leverage embedded analytics and built-in correlative intelligence to isolate the real root cause of application performance slowdowns automatically.
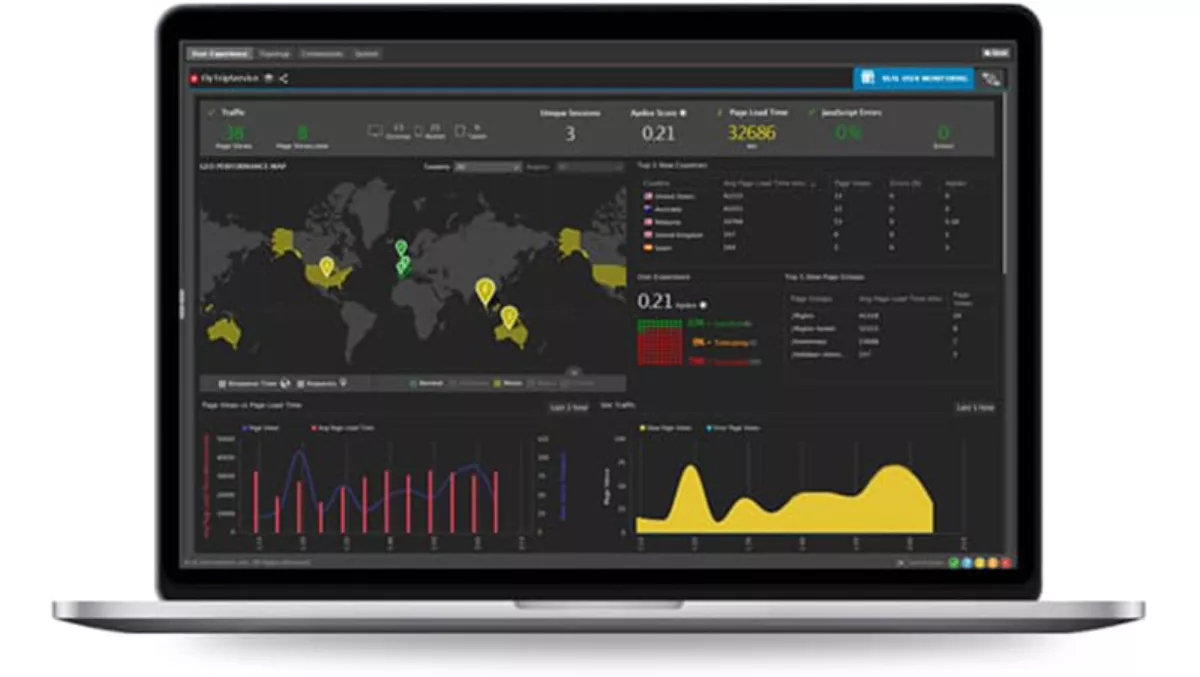 The eG Enterprise web console
In addition to the features outlined above, eG Enterprise allows organisations to:
- Monitor a wide range of applications: web applications (Java, Microsoft .NET, PHP), Citrix and virtual desktop technologies, SAP and other enterprise applications as well as SaaS applications like Microsoft 365.
- Track synthetic and real experience for users of these applications.
- Provide coverage for a broad range of technologies from one console including middleware, database servers, virtualisation platforms, cloud technologies, storage and network.
- Leverage out of the box integrations with ticketing and incident management tools like ServiceNow, PagerDuty, BMC Remedy and others.
It provides a single source of truth across applications code, business transactions, and IT infrastructure components. Additionally, eG Enterprise can differentiate the root cause of a problem from its effects, through its consideration of all application-to-application mappings, application-to-VM relationships, and application-to-network dependencies.
In a single click, IT administrators can monitor availability, health, performance and usage metrics, all by using intuitive dashboards.
Alerts are correlated across the layers, so administrators can easily pinpoint which layer is causing a problem. eG Enterprises uses built-in machine learning capabilities to auto-baseline performance metrics so that any deviations from the norm are promptly notified.
Out-of-the-box reports and analytics help with trending, forecasting and capacity planning, delivering insights for infrastructure right-sizing and optimisation.
Gaining actionable answers to performance issues, wherever they originate, is one of the most critical endeavours of both application owners and IT administrators.
With converged application and infrastructure monitoring, users can better understand the impact of infrastructure issues on application performance and UX, thereby ensuring improved user experience and IT efficiency.
To learn more about eG Enterprise, click here.